Charting Snakes and Ladders
First draft September 2025.
Introduction
Snakes and Ladders is a common family boardgame played across anglophone countries often as a pedogeological tool introducing skills to children such as arithmetic as well as providing a general introduction to boardgames. However, despite sharing some of the game mechanics with European games tracing back to 15th century Florentine Game of the Goose, the origin of the game is from the Indian subcontinent rather than the West. In addition, the pedogeological function of the game originally included a religious element which is now omitted from most popular forms of the game.
The purpose of this work is to make a useful characterisation of the game using some reasonable metrics. This will provide an analytical baseline to compare alternative variations of the game and a useful resource for future game development.
Snakes and Ladders
A Brief History
The game was eventually introduced to the West by British colonialists at the end of the 19th century. In translation, the Eastern religious references were replaced by Victorian virtues, echoing existing games such as Virtue Rewarded and Vice Punished and The Game of Human Life [1]. At least initially, the Indian origins of the game were often portrayed through colonial depictions of the subcontinent (characters, landscapes, artefacts) and although these fell away after Indian independence the snakes and ladders device remained. The game made its way to the United States in the the first half of the 20th century where it was renamed Chutes and Ladders for the non-Imperial market.
The original British version of Snakes and Ladders had a 100-tile board with a spiral path “ascending” to the centre [2]. Within a year the 10x10 board with boustrophedon ascending path from bottom to top (a feature of the existing examples from the subcontinent) was introduced. This remains the modern standard, however, crucially the number and positions of snakes and ladders on the board have never been standardised. Today the game has global distribution including India where it has supplanted its ancestors in popularity as a children’s pastime.
Materials & Rules
Standard game material and rules are defined as follows:
Game material:
- Numbered 100-tile (10x10) board, advancing vertically boustrophedon fashion
- Six-sided die (modern) or 6 cowries (traditional)
Game rules:
- All players begin off the board (equivalent to tile 0)
- Player tokens are moved in accordance with die values until a marker coincides with the foot of a ladder, head of a snake, or the token position exceeds tile-99
- Landing on the foot of a ladder advances the player token to the top of the ladder
- Landing on the head of a snake regresses player token to the bottom the of the snake
- The game ends when a player’s token position exceeds tile-99
Popular variations:
- 6-rule (6R): if a die roll of 6 is obtained, the player gets another roll of the die
- 6-rule + restart (6R+R): following the 6-rule, but with the penalty of re-starting from tile-1 and ending the turn if three sequential die rolls of 6 are obtained
- 6-begin (6B): a player must roll a 6 to begin ascent on the board
- 100-rule (100R): the final position obtained must be exactly tile-100. If the die number exceeds tile-100 the marker remains unmoved
Capturing the Game
Characterisation Metrics
Features of the game can be characterised with reference to defined metrics. Here the metrics are:
- Game length: number of turns per player before the win condition is satisfied
- Preference of any players to win
- Number of snakes encountered during the game per player
- Number of ladders encountered during the game per player
- Final position (if 100-rule is not used)
Since progress through the game is based on the stochastic mechanism of die rolls (or traditionally cowries) the aggregation of metric values over repeated games results in probabilistic distributions. These are quantified for comparison using the mean and standard deviations of the distributions.
Once baseline distributions have been compiled for the standard game settings, the effects of variations in material and rules can be comparatively quantified. Here, the four variations above are compared.
Simulation Method
The simulation and characterisation of Snakes and Ladders is relatively straightforward in comparison to games which include player choice. The game is a race which depends only on the probabilistic outcome of some mechanism of chance, for example a die, spinner or coin. This avoids difficulties in simulating decision making or choice strategies of actors in the game.
Game characterisations and comparisons were carried out by simulations made using Python3 and documented in a git repository1. The simulations include pseudo-random numbers to the simulate stochastic nature of die or cowrie rolls. Following [3], for each variation ten samples were simulated, each with 10,000 games (an order of magnitude higher than [3]).
Investigations
Investigations were made over the following topics:
- Chance mechanisms: a comparison of the modern method using a six-sided die and the traditional six cowrie method.
- Single player characterisation: quantification of the game characteristics using the defined metrics.
- Standard rule variations: quantification of the effects of some standard variations of the rules on characterisation metrics.
- Alternative gameboard: an example of the effect of altering the distribution of snakes and ladders on the game board.
- Number of Players: comparison of the number of players on game metrics.
- Alternative chance mechanism: an example of the effect of altering the chance mechanism for deciding moves per turn.
Investigation 1: Chance Mechanisms
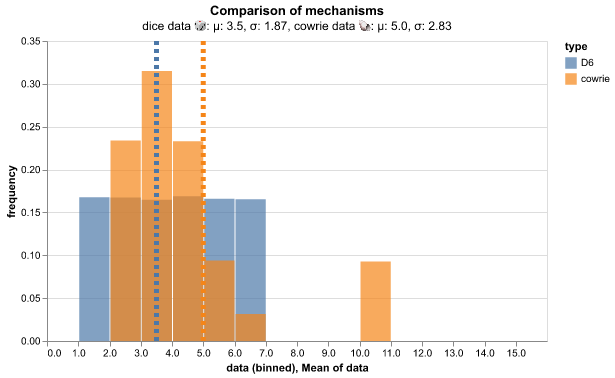
The modern mechanism of advancing through a Snakes and Ladders board uses a fair six-sided die, where fair means there is an equal chance of the die landing on any side. This method requires some technological a process to manufacture and distribute such an impartial artefact, which has not always been as available as it is today. The traditional mechanism of advancement through the game used cowrie shells (from small sea snails) which are found around the world and are abundant in the Indian Ocean. It is understood [2] six cowries were thrown with a mapping of the pattern to a numeric value. For the purposes of simulation it is assumed each cowrie behaves like a fair coin such that there is an equal chance of landing up or down2. Table 2 defines the mapping described in [2]. The larger scoring range for cowries (up to 10 rather than 6) produces a wider variation with each throw, which is quantified in the standard deviation of the cowrie dataset iterations.
| Pattern | Score |
|---|---|
| 5d, 1u | 10 |
| Xu, Yd | X,Y in [1,5] |
| 6u, 0d | 6 |
| 0u, 6d | 6 |
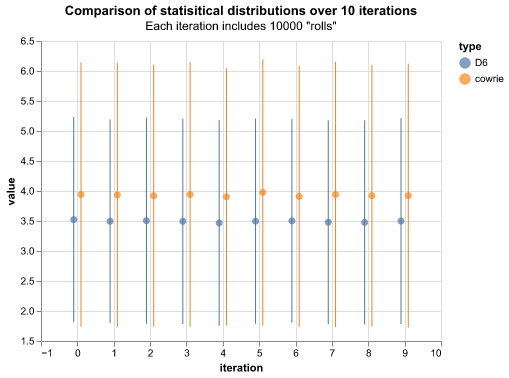
Table 2 and figure 1 show the statistical comparison of die and cowrie methods over the ten datasets of 10,000 iterations. The statistical results are consistent across the simulation iterations for each dataset. The average D6 value is as expected for an equal probability shared across all possible values: x ̅=(∑_(k=1)^6▒〖k 〗)⁄(6 =3.5). The average cowrie value per roll is larger in part due to the possible scoring of 10 and also due to the unequal probability of each score. Figure 2 compares the probability distributions for each method. Significantly there is no probability of a value of 1 for scoring cowrie rolls.
| iteration | D6_ave | D6_std | cowrie_ave | cowrie_std |
|---|---|---|---|---|
| 0 | 3.5230 | 1.710779 | 3.9416 | 2.202470 |
| 1 | 3.4960 | 1.696783 | 3.9332 | 2.202458 |
| 2 | 3.5057 | 1.717575 | 3.9204 | 2.182874 |
| 3 | 3.4940 | 1.709929 | 3.9415 | 2.206256 |
| 4 | 3.4674 | 1.715701 | 3.9038 | 2.143550 |
| 5 | 3.4964 | 1.708765 | 3.9758 | 2.219078 |
| 6 | 3.5028 | 1.698258 | 3.9097 | 2.177159 |
| 7 | 3.4796 | 1.698962 | 3.9417 | 2.210427 |
| 8 | 3.4768 | 1.700691 | 3.9211 | 2.182327 |
| 9 | 3.4985 | 1.715777 | 3.9219 | 2.198882 |
Investigation 2: Single Player Characterisation
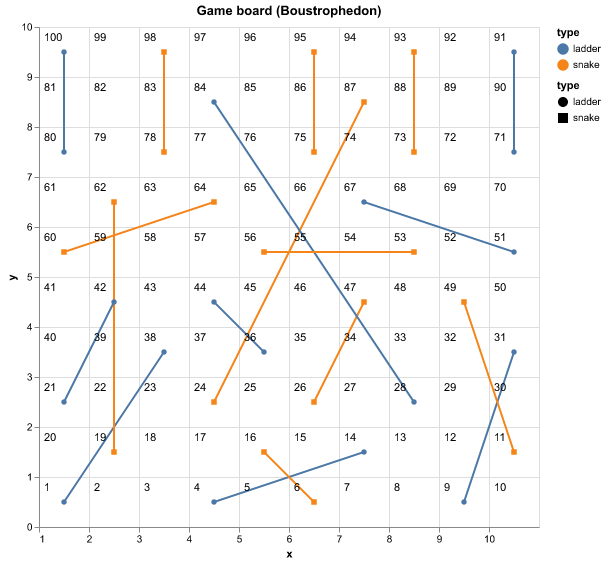
Tables 3 and 4 show the statistical characterisation of the number of turns per game and the proportion of wins per player over ten samples of 10,000 games. Rolls of a six-sided die provide the mechanism of advancement. The game board (specifying positions of snakes and ladders over the 10x10 grid) defined in [3] was used3. The game board is visualised in appendix B. In general, the consistency of results across the ten iterations indicates the reliability of the simulation and the sufficiency of the sample size to draw conclusions.
Table 3 shows the characterising statistics for game length for ten sets of 10,000 games; these include the average number of turns per game (moves_ave), the standard deviation (moves_std), the maximum number of moves (moves_max) and the minimum number of moves (moves_min). The average game takes around 35 turns, though substantial variation is found in the sample (characterised in the standard deviation) of greater than 50%. The variability is reflected in the maximum number of game turns found in each sample which can rise many times the mean (in principle to infinity). The minimum number is consistent as there is a lower bound to the number of turns required to traverse the gameboard. To achieve the minimum game length, a minimum number of dice throws is combined with the best-case path in ascending the available ladders. This makes the minimum number of turns required to traverse the board specific to the gameboard layout of snakes and ladders. This will be revisited in section 3.
| iteration | moves_ave | moves_std | moves_max | moves_min |
|---|---|---|---|---|
| 0 | 35.71190 | 23.194941 | 274 | 7 |
| 1 | 35.72830 | 22.909181 | 249 | 7 |
| 2 | 35.46620 | 22.926178 | 235 | 7 |
| 3 | 35.63140 | 23.365755 | 210 | 7 |
| 4 | 35.77370 | 23.013997 | 230 | 7 |
| 5 | 36.12680 | 23.592825 | 241 | 7 |
| 6 | 35.54190 | 23.124103 | 247 | 7 |
| 7 | 36.17520 | 23.495249 | 233 | 7 |
| 8 | 35.80440 | 23.072988 | 215 | 7 |
| 9 | 35.73070 | 23.536048 | 301 | 7 |
| comb | 35.76905 | 23.224402 | 301 | 7 |
Table 4 shows the average number of encounters with snakes and ladders per game for ten sets of 10,000 games. The average number of encounters with snakes or ladders (snakes_ave and ladders_ave, respectively) roughly agree between as there are roughly equal numbers of snakes (9) and ladders (8) on the gameboard. However, the variation from the mean (snakes_std and ladders_std, respectively) is roughly twice as large for snakes as ladders. This reflects the decreased likelihood of encountering another snake or ladder after encountering a ladder, as the player position will be advanced to the ladder top, closer to the finish position and (possibly irreversibly) beyond intervening snakes and ladders. Conversely, by pushing the player back in game position, encountering a snake introduces another opportunity to encounter a snake or ladder - at the very least the same snake. Again the probable number of encounters with snakes or ladders during the game is dependent on the specific gameboard.
| iteration | snakes_ave | snakes_std | ladders_ave | ladders_std |
|---|---|---|---|---|
| 0 | 3.93640 | 3.744243 | 3.23310 | 1.788543 |
| 1 | 3.92530 | 3.686174 | 3.18360 | 1.752540 |
| 2 | 3.90950 | 3.686173 | 3.19530 | 1.744495 |
| 3 | 3.90480 | 3.743199 | 3.20920 | 1.768148 |
| 4 | 3.95510 | 3.706030 | 3.20420 | 1.778600 |
| 5 | 3.99780 | 3.810885 | 3.21660 | 1.799391 |
| 6 | 3.89920 | 3.709530 | 3.20440 | 1.763216 |
| 7 | 3.99470 | 3.757803 | 3.22540 | 1.771019 |
| 8 | 3.95990 | 3.702440 | 3.19660 | 1.731083 |
| 9 | 3.90490 | 3.765219 | 3.20680 | 1.788003 |
| comb | 3.93876 | 3.731364 | 3.20752 | 1.768620 |
Table 5 shows the average final position of the winning player in each game. The propensity of the finish position to be close to tile-100 is dependent on the specific position of snakes and ladders on the game board, particularly in the last six tiles. In this case, penultimate positions on tiles 95 and 97 (which could result in finish positions up 101 and 103 respectively) are suppressed to due to the occupying snakes. This lowers the probability of exceeding tile-100 at the end of the game. In addition, the ladder on tile 80 advances the player to tile-100 and ends the game before there is an opportunity to exceed tile-100.
| iteration | final_ave | final_std |
|---|---|---|
| 0 | 100.8327 | 1.293862 |
| 1 | 100.8555 | 1.312552 |
| 2 | 100.8440 | 1.320469 |
| 3 | 100.8370 | 1.310879 |
| 4 | 100.8305 | 1.299284 |
| 5 | 100.8120 | 1.284609 |
| 6 | 100.8328 | 1.297926 |
| 7 | 100.8411 | 1.295229 |
| 8 | 100.8351 | 1.283539 |
| 9 | 100.8493 | 1.305741 |
| comb | 100.8370 | 1.300459 |
Using these distributions as reference, the effects of game variations can be compared using the characteristic distributions.
Investigation 3: Standard Rule Variations
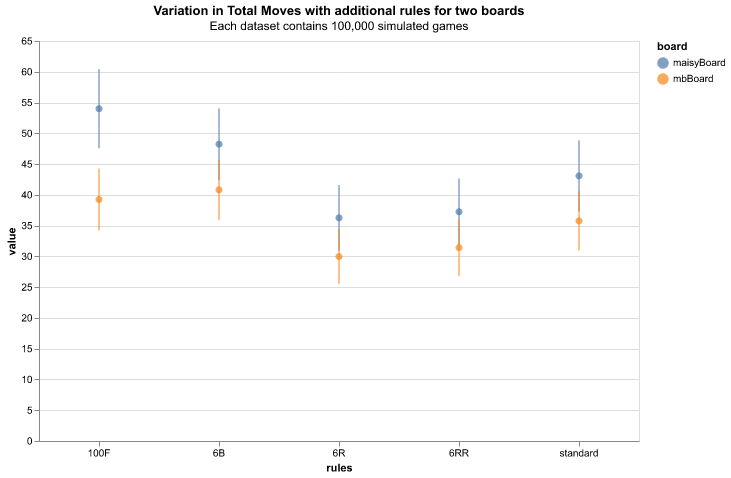
The effects of the variations are compared using the metrics of game length, snakes and ladders encounters and finish position. Ten game datasets of 10,000 were combined to produce overall averages of 100,000 game iterations.
Figure 3 shows the variation in game duration, measured in number of turns, with different game rules. Using the standard rule set as a reference, the game duration is decreased by the introduction of additional rolls when a die roll of six is obtained (6R) as it is possible to traverse more tiles per turn. The additional penalty for three consecutive die rolls (6RR) slightly mitigates the reduction in game length, though it remains a shorter when compared to the standard rule set. Both the additional rules requiring a die roll of a six to begin the game (6B) and the precise finish position on tile-100 (100F) increase the game length as supplementary hurdles to game advancement must be overcome. As a test of consistency, point 100F agrees with the same rule set simulation in [3].
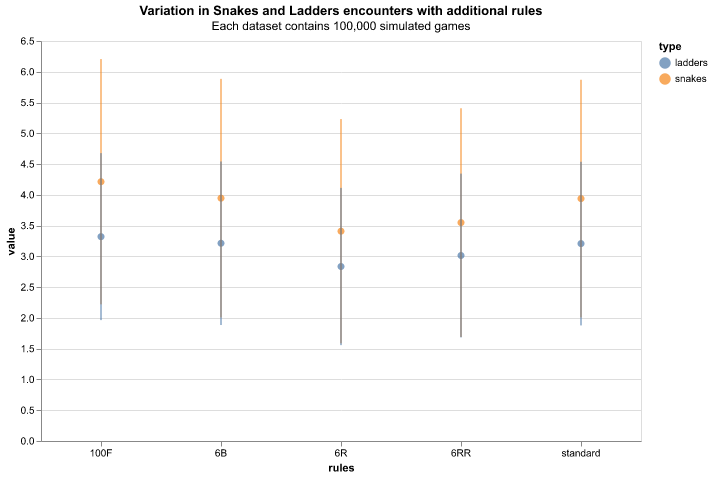
Figure 4 shows the average encounters with snakes and ladders across variations in game rules. The general feature is seen across all game variations where encounters with snakes are more numerous than encounters with ladders. This continues the trend seen above where player position will be advanced by ladders, limiting opportunities for further encounters, while snakes will produce further opportunities by player regression. The average encounters across all rule variations generally follow the game length trend. This is reasonable as there is less opportunity for snake or ladder encounters with faster advancement through the game. The exception to this behaviour is the six-to-begin rule (6B) which does not follow the relative trend in snake and ladder encounters as in game duration. This is explained as the requirement of a six to enter the gameboard does not affect the propensity to encounter a snake or ladder, hence this is equivalent to the standard rule set.
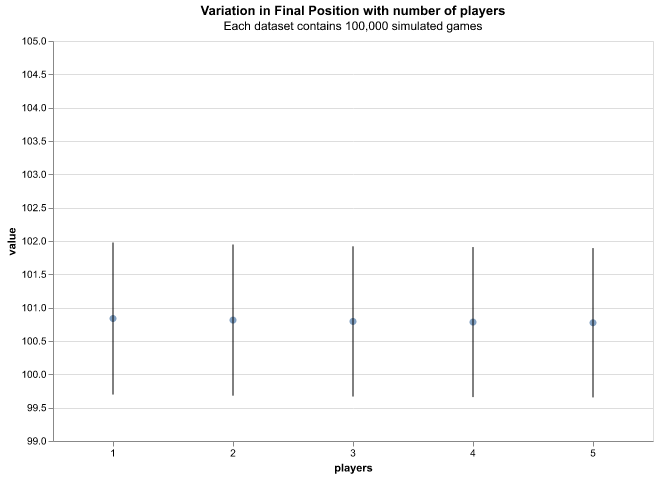
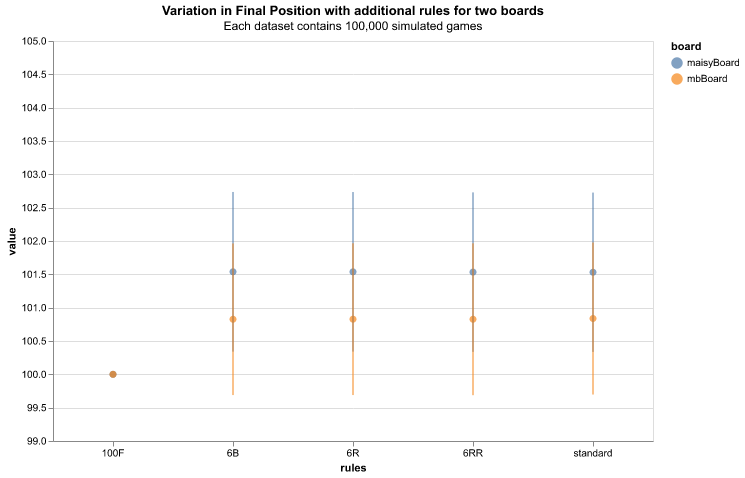
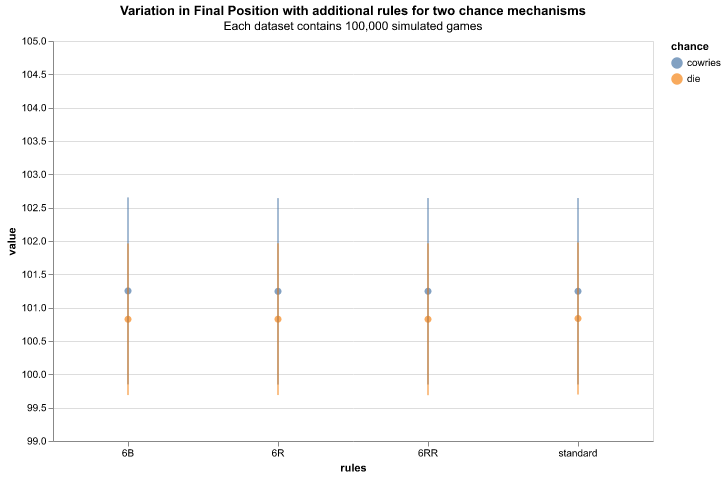
Figure 5 shows the average final position across variations in game rules. The final position is consistent across alternative rule sets, with the obvious exception of the exact finish position requirement (100R). This suggests the metric is not affected by additional dice rolls; rather, as shown below, the layout of the game board is the significant influence.
Investigation 4: Alternative Gameboard
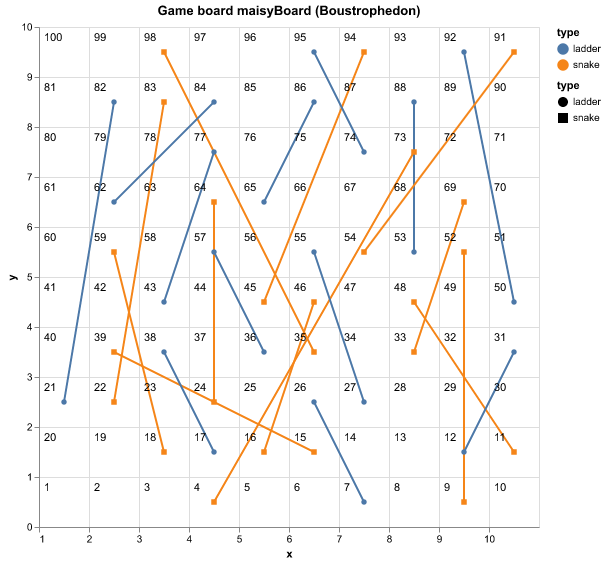
The “standard” and “alternative” gameboards are depicted in Appendix B. Without considering the detailed positions of snakes and ladders, a significant difference between the boards is the number of snakes and ladders: 10 snakes to 9 ladders in the standard board and 12 snakes to 12 ladders in the alternative case. Ten game datasets of 10,000 were combined to produce overall averages of 100,000 game iterations.
Table 6 shows the variation in average, maximum and minimum number of turns per game with gameboard variations. The alternative board has higher average and maximum game length. Specific investigation is required concerning snakes and ladders positions, but the increased density of snakes and ladders on the alternative gameboard makes encounters with snakes and ladders more likely as shown in table 7. The increased encounters with snakes lengthen game duration in general.
| board | moves_ave | moves_std | moves_max | moves_min |
|---|---|---|---|---|
| standard | 35.76905 | 23.224402 | 301 | 7 |
| alternative | 43.08316 | 33.381916 | 401 | 7 |
| board | snakes_ave | snakes_std | ladders_ave | ladders_std |
|---|---|---|---|---|
| standard | 3.93876 | 3.731364 | 3.20752 | 1.768620 |
| alternative | 5.29487 | 5.724098 | 5.58845 | 4.235070 |
Table 8 shows the variation in final (winning) positions with different game rules. The “alternative” board has a higher finish position due to the variation in snakes and ladders configurations in the last 6 tiles. The alternative board has one snake in the final region, compared to the two in the standard case, and does not have a ladder which finishes on the 100-tlle. This provides more opportunity in the alternative case to exceed the 100-tile when winning the game.
| board | final_ave | final_std |
|---|---|---|
| standard | 100.8370 | 1.300459 |
| alternative | 101.53146 | 1.428012 |
Investigation 5: Number of players
This comparison quantifies the effects on game metrics of increasing the number of players. It is worth noting, players progression does not interfere across participants. Ten game datasets of 10,000 were combined to produce overall averages of 100,000 game iterations.
Figure 8 shows the variation in game duration, measured in number of turns, with number of players. There is a decrease in game duration as the number of players increases. This can be understood as increasing the chance of faster advancement through the gameboard with each player. As the game ends as soon as a single player achieves tile-100, the addition of another player introduces an opportunity to outperform the last in traversing the tiles. If the added players should perform worse, the success of existing players is unaffected. Hence, the advent of additional players can only reduce the gam duration. Counterfactually, if the rules required all players to make it to tile-100 before the game ended then the game length would increase with additional players as each would offer an opportunity for poorer performance.
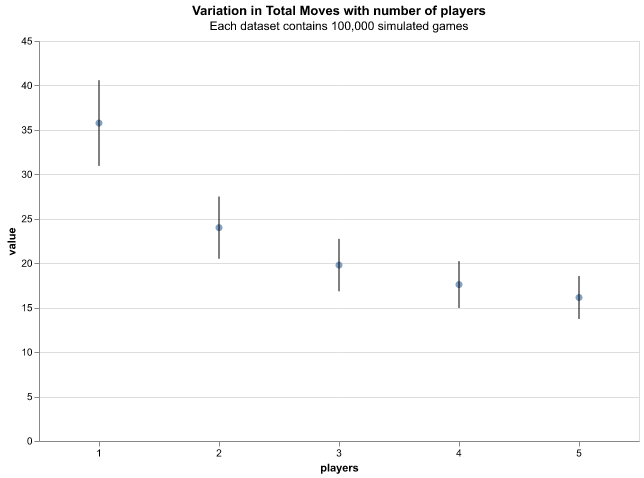
Figure 9 shows the variation in final (winning) positions with the number of players. This is consistent across the number of players. As mentioned, players cannot interfere with one another during the game so increasing the number of participants has no effect on player progression. The dynamics of ending the game are repeated for each player just as iterations of the simulation. Hence, the distributions of final positions agree across variations in the number of players.
Investigation 6: Alternative Chance Mechanism
To investigate effects of an alternative mechanism of chance, the six-sided die was changed to six cowries as described above. Datasets were then generated for single player simulations with various rules sets. The die values below are as repeated from the preceding simulations with the cowries results added for comparison. It should be noted that a dataset for an exact finish on tile-100 (100F) was not possible to generate as (using the mapping described above) cowries do not have a corresponding pattern for a single tile move. This meant it was possible for the player to become stuck on tile-99 without a possible move to finish the game.
Figure 10 shows the variation in game duration, measured in number of turns, with different game rules and chance mechanisms. For the standard game (without additional rules) the average cowrie game is shorter than the equivalent die game. This is due to the higher average value per “roll” (as shown in figure 2). 6R and 6RR rulesets produce similar results for both chance mechanisms. This indicates the difference in “roll” is washed by the introduction of the re-roll mechanism which has a greater effect (raising the average move value per turn) for die based games, where the chance of obtaining a value of six is greater than for cowries (as shown in figure 2). The 6B comparison is similar to the standard case, which suggests the increased likelihood of rolling a six to start the game in the die-based case does is not make up for the lower move score, on average, over the course of the game.
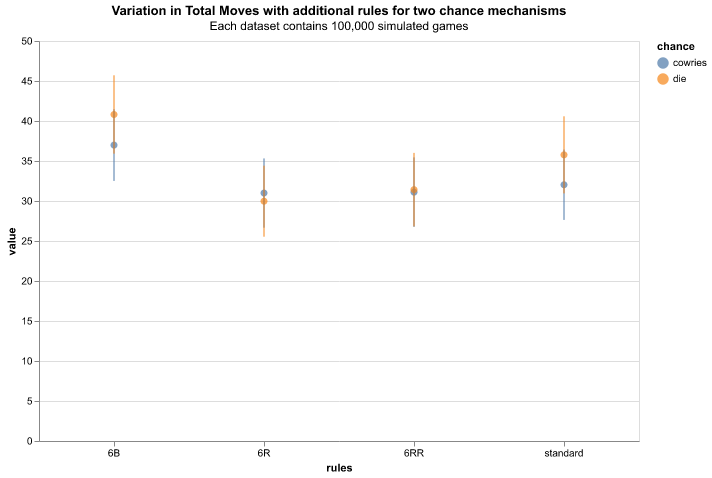
Figure 11 shows the variation in game duration, measured in number of turns, with different game rules and chance mechanisms. The relative finishing positions across rulesets is flat for cowrie and die datasets, as this is influenced by the board layout which is shared between all datasets. In general, cowrie-based simulations show higher average finishing position. This is due to the higher average and possible roll values for the cowrie mechanism. The average value is not only higher, meaning the chance of exceeding tile-100 is greater, but the maximum roll value is greater meaning tiles up to 109 (tile-99 + a roll of 10) are accessible in the cowrie case.
Summary
The game of Snakes and Ladders has been characterised using metrics of game duration, encounters with snakes and ladders and final positions. Simulations were carried out to quantify the effects on these metrics in the cases of additional rules, alternative board layout, additional number of players and an alternative chance mechanism. These were found to be explicable when considering the relevant features of the game.
It is hoped this characterisation will provide a baseline dataset for future assessment of game variations in rule set and mechanics.
Appendices
Appendix A: Variations in Gameboard Structure
| Tiles | Snakes | Ladders | Description |
|---|---|---|---|
| 85 | 9 | 4 | "board of knowledge" |
| 72 | 10 | 8 | |
| 72 | 10 | 11 | "moderate optimism about the human condition" |
| 72 | 10 | 10 | |
| 72 | 9 | 4 | |
| 72 | 9 | 7 | |
| 72 | 8 | 6 | |
| 84 | 12 | (7+9) | Hindu |
| 84 | 9 | 5 | Hindu |
| 84 | 9 | 5 | Jain |
| 84 | 9 | 5 | Jain |
| 84 | 10 | 8 | Jain |
| 84 | 12 | 7 | Jain |
| 84 | 9 | 6 | Jain |
| 106 | 16 | ? | Jain |
| 100 | 13 | 17 | Muslim (Sufi) |
| 100 | 13 | 17 | |
| 100 | 11 | 16 | |
| 165* | 31 | >40 | Hindu *includes compartment grids |
| 167 | 15 | 13 | |
| 122 | 12 | 10 | |
| 130* | 30 | 20 | *includes compartment grids |
Appendix B: Game Boards
Gameboards used to simulate games:
- Figure 10 is the “standard” layout, based on Milton Bradley snakes and ladders version
- Figure 11 is the “alternative” layout, based on Maisy‘s Giant Snakes and Ladders version
References and Footnotes
References
| Ref code | Title | Author(s) | Date | Publication |
|---|---|---|---|---|
| 1 | Snakes and Ladders in India: Some Further Discoveries | Andrew Topsfield | 2006 | Artibus Asiae, 66, 1, 143-179 |
| 2 | The Indian Game of Snakes and Ladders | Andrew Topsfield | 1985 | Artibus Asiae, 46, 3, 203-226 |
| 3 | How Long Is a Game of Snakes and Ladders? | S C Althoen, L King, K Schilling | 1993 | The Mathematical Gazette, 77, 478, 71-76 |
Footnotes
-
This is obviously inaccurate, and a more rigorous study would try to replicate the real distribution. For the purposes here it is enough to show an alternative method of advancement is possible. ↩
-
Snake positions: 16:6, 47:26, 49:11, 56:53, 62:19, 64:60, 87:24, 93:73, 95:75, 98:78; Ladder positions: 1:38, 4:14, 9:31, 21:42, 28:84, 36:44, 51:67, 71:91, 80:100 ↩